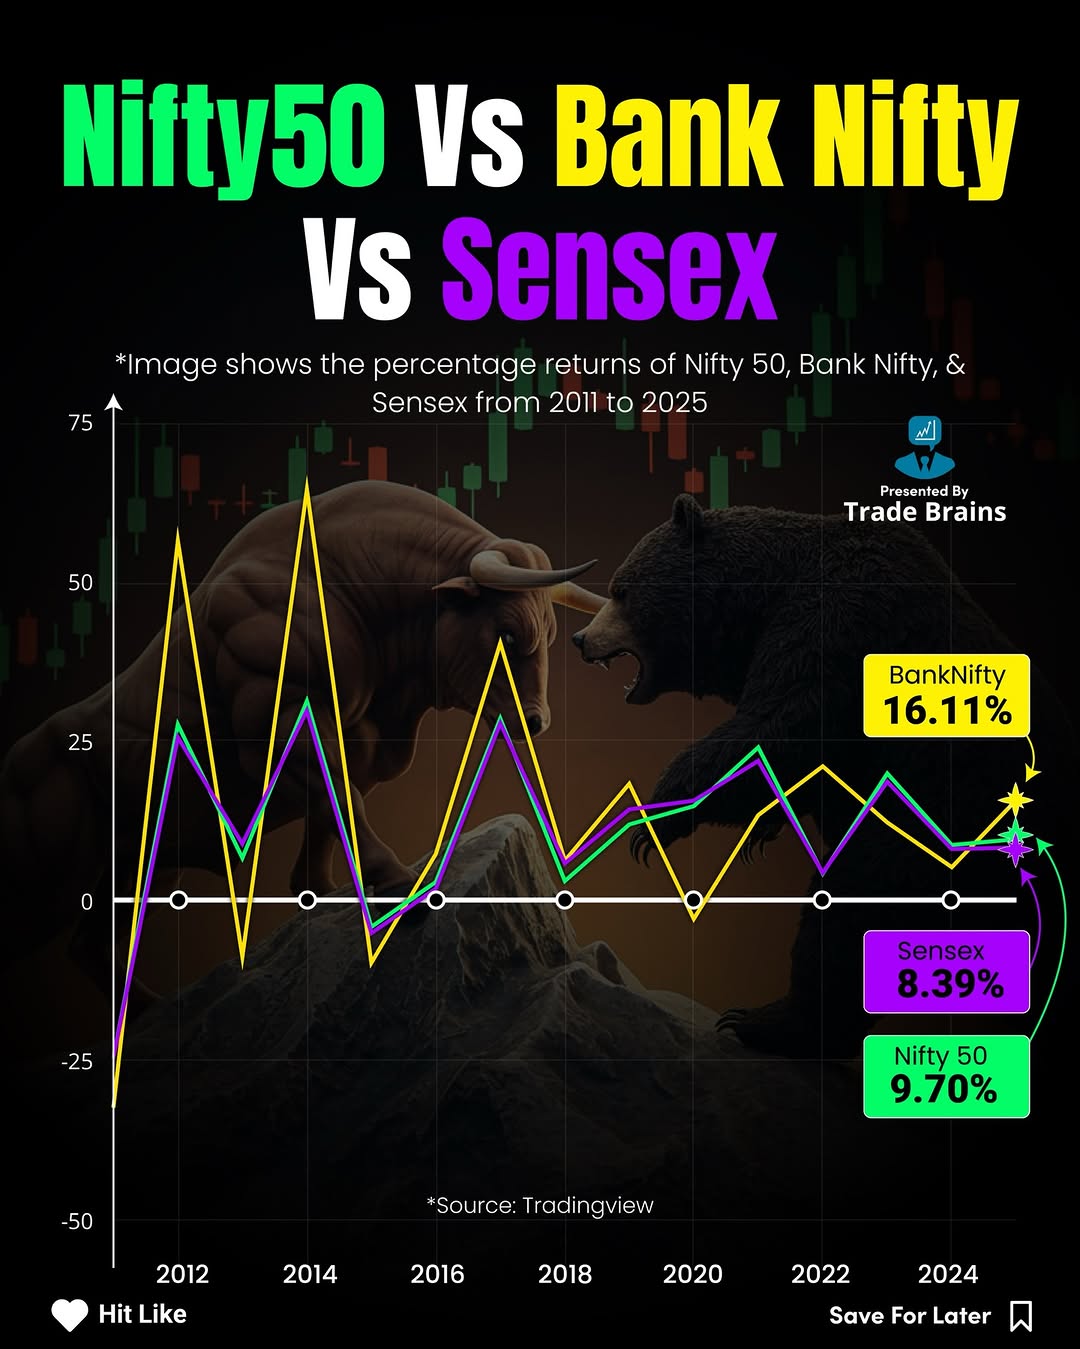
Markets tell their story over time. 📈 This image highlights the percentage returns of India’s key indices — Nifty 50, Bank Nifty, and Sensex — from 2011 to 2025. Over the years, each index has reflected different phases of economic growth, market cycles, and sectoral leadership. Which index do you think delivered the best risk-adjusted returns over this period? Follow @trade.brains Follow @trade.brains #ᴇxᴘʟᴏʀᴇᴘᴀɢᴇ #nifty50 #banknifty #sensex #stockmarketindia #marketreturns #indianstockmarket #infographics #tradebrains (Nifty 50, Bank Nifty, Sensex, market returns, long term investing, Indian stock market, index performance)
 Hidden
  0
0 This post was published on 30th December, 2025 by Trade on his Instagram handle "@trade.brains (Tradebrains)". Trade has total 564.4K followers on Instagram and has a total of 2.4K post. Trade receives an average engagement rate of 0.2% per post on Instagram. This post has received 0 comments which are lower than the average comments that Trade gets. Overall the engagement rate for this post was lower than the average for the profile. #tradebrains #stockmarketindia #marketreturns #nifty50 #sensex #indianstockmarket #infographics #banknifty has been used frequently in this Post.
Hidden 1  03-01-2026 Hidden 0 02-01-2026 Hidden 1 02-01-2026 2.0K 9 02-01-2026 Hidden 1 02-01-2026 Hidden 1 02-01-2026 Hidden 1.3K 01-01-2026 Hidden 5 01-01-2026 Hidden 0 01-01-2026 Hidden 0 01-01-2026 Hidden 0 01-01-2026 Hidden 0 01-01-2026 970 1 31-12-2025 4.1K 7 30-12-2025 Hidden 265 29-12-2025 Hidden 1 28-12-2025 981 5 27-12-2025 633 4 26-12-2025 Hidden 2 25-12-2025 386 15 24-12-2025 Hidden 2 23-12-2025 Hidden 32 22-12-2025 322 2 21-12-2025 312 1 20-12-2025 1.1K 14 19-12-2025 Hidden 17 18-12-2025 1.9K 8 17-12-2025 359 5 16-12-2025 2.4K 330 15-12-2025 249 0 14-12-2025 Hidden 78 13-12-2025 Hidden 9 12-12-2025 1.7K 11 11-12-2025 Hidden 166 10-12-2025 499 3 09-12-2025 1.3K 6 08-12-2025 433 6 07-12-2025 780 3 06-12-2025 1.3K 136 05-12-2025 Hidden 1.2K 04-12-2025 2.0K 12 03-12-2025 324 2 02-12-2025 758 14 01-12-2025 131 1 30-11-2025 1.1K 13 29-11-2025 821 3 28-11-2025 1.8K 11 27-11-2025 493 4 26-11-2025 3.7K 125 26-11-2025 578 15 25-11-2025 1.0K 22 24-11-2025 1.4K 19 23-11-2025 577 3 22-11-2025 7.6K 198 21-11-2025 664 1 20-11-2025 803 2 19-11-2025 79 1 19-11-2025 5.6K 72 18-11-2025 197.8K 1.0K 14-10-2025