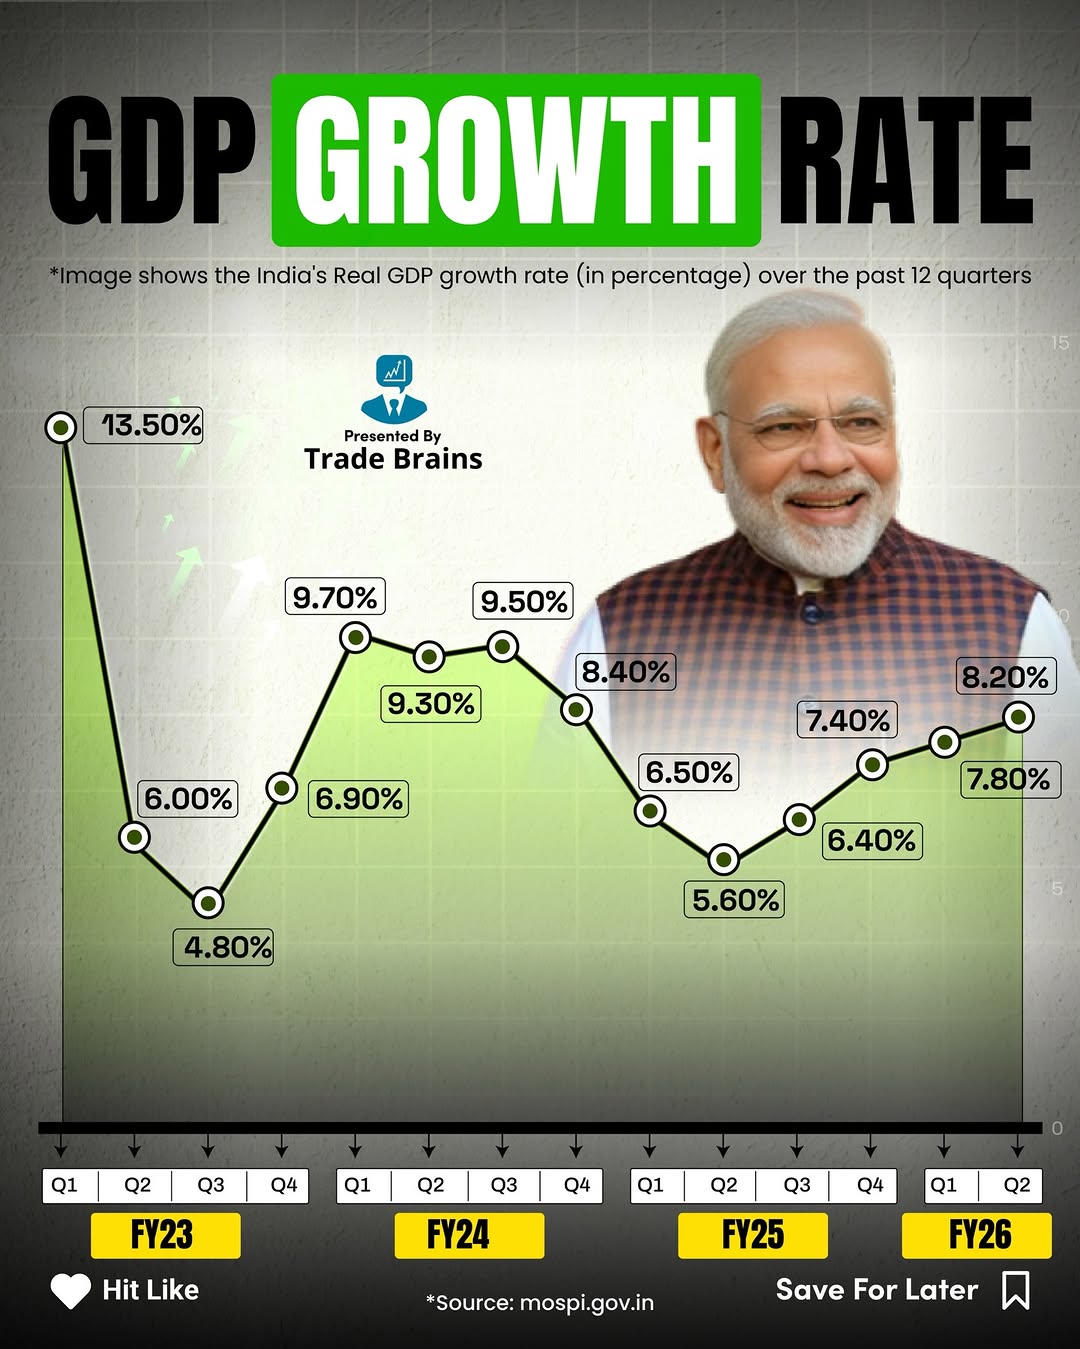
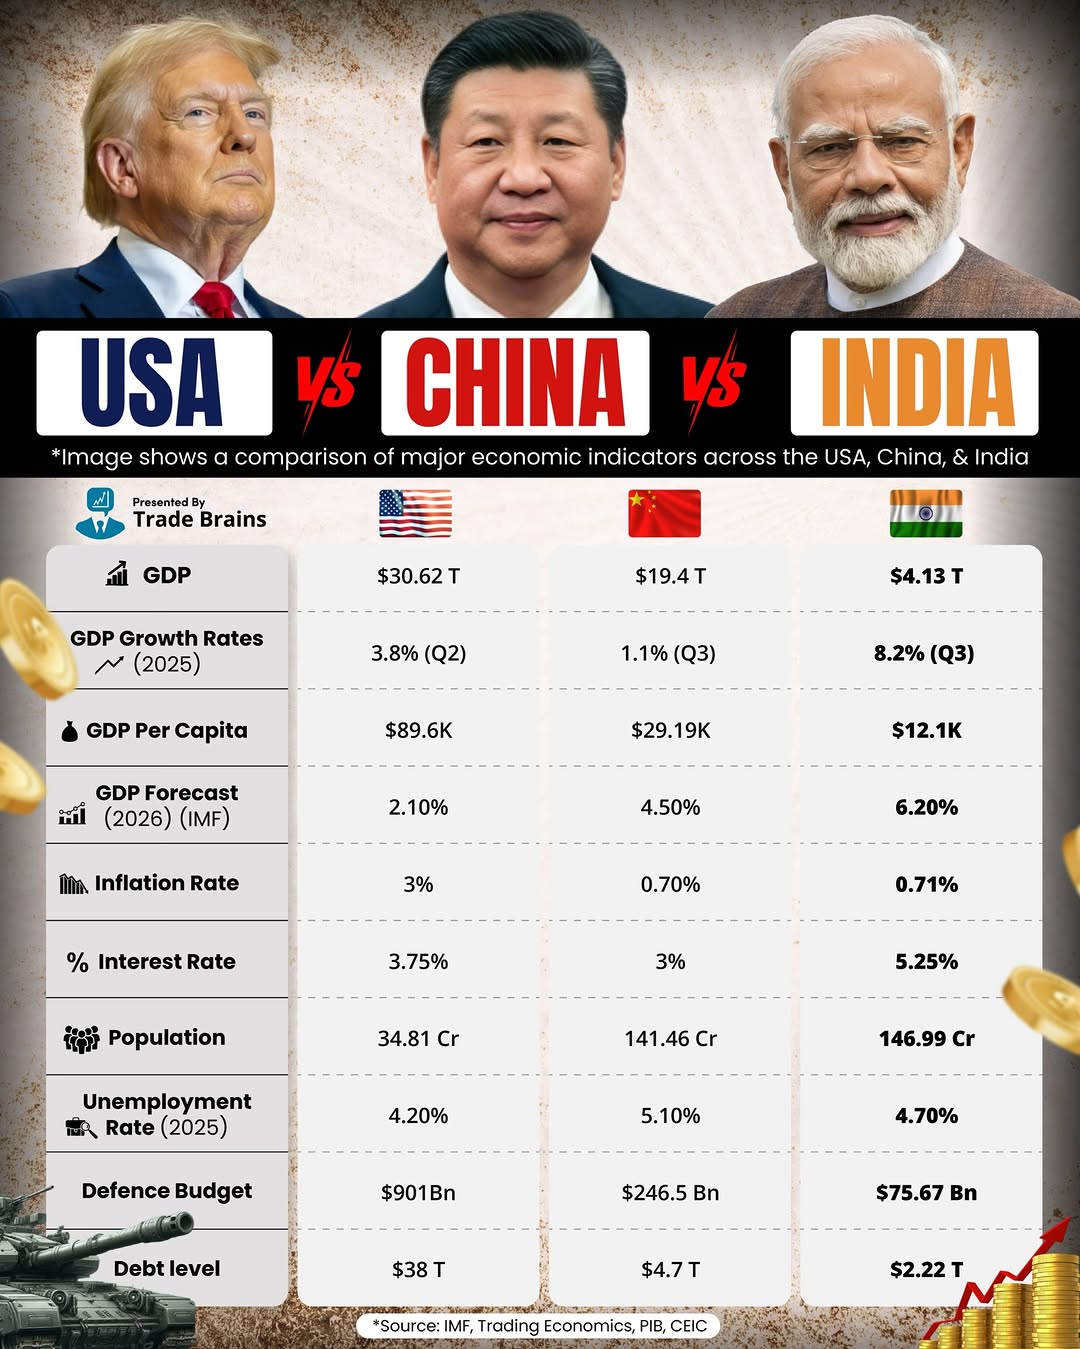
India’s GDP Growth: A 12-Quarter Journey 📊🇮🇳 This graph tracks India’s Real GDP growth rate across the last 12 quarters, offering a clear view of how the economy has shifted through global slowdowns, domestic recoveries, policy changes, and demand cycles. This timeline helps analysts understand the broader economic narrative — whether growth is stabilising, accelerating, or facing temporary headwinds. Which sectors do you think will drive the next leg of GDP expansion? Follow @trade.brains Follow @trade.brains #indiagdp #gdp #indiangdp #gdp2025 #economicgrowth #indianeconomy #grossdomesticproduct #gdpindia #infographic #economic #economicgrowth (India GDP, Real GDP Growth, Economic Trends, Quarterly Data, India Economy, Macroeconomics, Growth Rate, Market Analysis, Recovery Cycle, Economic Performance, Traders Insight, Finance Data, Economic Indicators)
 758
758  14
14 This post was published on 01st December, 2025 by Trade on his Instagram handle "@trade.brains (Tradebrains)". Trade has total 564.4K followers on Instagram and has a total of 2.4K post.This post has received 758 Likes which are lower than the average likes that Trade gets. Trade receives an average engagement rate of 0.2% per post on Instagram. This post has received 14 comments which are lower than the average comments that Trade gets. Overall the engagement rate for this post was lower than the average for the profile. #gdp2025 #indiangdp #indiagdp #indianeconomy #grossdomesticproduct #economic #gdpindia #infographic #economicgrowth #gdp has been used frequently in this Post.
Hidden 1  03-01-2026 Hidden 0 02-01-2026 Hidden 1 02-01-2026 2.0K 9 02-01-2026 Hidden 1 02-01-2026 Hidden 1 02-01-2026 Hidden 1.3K 01-01-2026 Hidden 5 01-01-2026 Hidden 0 01-01-2026 Hidden 0 01-01-2026 Hidden 0 01-01-2026 Hidden 0 01-01-2026 970 1 31-12-2025 4.1K 7 30-12-2025 Hidden 0 30-12-2025 Hidden 265 29-12-2025 Hidden 1 28-12-2025 981 5 27-12-2025 633 4 26-12-2025 Hidden 2 25-12-2025 386 15 24-12-2025 Hidden 2 23-12-2025 Hidden 32 22-12-2025 322 2 21-12-2025 312 1 20-12-2025 1.1K 14 19-12-2025 Hidden 17 18-12-2025 1.9K 8 17-12-2025 359 5 16-12-2025 2.4K 330 15-12-2025 249 0 14-12-2025 Hidden 78 13-12-2025 Hidden 9 12-12-2025 1.7K 11 11-12-2025 Hidden 166 10-12-2025 499 3 09-12-2025 1.3K 6 08-12-2025 433 6 07-12-2025 780 3 06-12-2025 1.3K 136 05-12-2025 Hidden 1.2K 04-12-2025 2.0K 12 03-12-2025 324 2 02-12-2025 131 1 30-11-2025 1.1K 13 29-11-2025 821 3 28-11-2025 1.8K 11 27-11-2025 493 4 26-11-2025 3.7K 125 26-11-2025 578 15 25-11-2025 1.0K 22 24-11-2025 1.4K 19 23-11-2025 577 3 22-11-2025 7.6K 198 21-11-2025 664 1 20-11-2025 803 2 19-11-2025 79 1 19-11-2025 5.6K 72 18-11-2025 197.8K 1.0K 14-10-2025