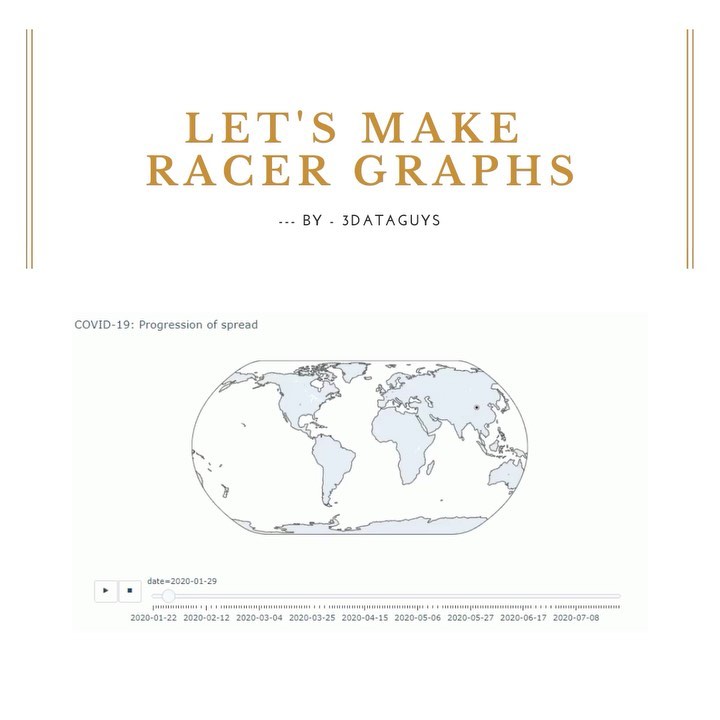


A perfect way to visualize Time Series data - Racer Graphs. Here is a graph for Covid-19 spread. Swipe left for the code. . Credits: @adornandtravel.priya . Try Racer Plot on your data and share. We will feature it in our stories. . #dataanalytics #datascience #visualization #graphs #python #ai #powerbi #tableau #ai #nlp #analytics #tips #ml #coding #geeks #datavisualization #datavisualisation #dataviz
This post was published on 18th August, 2020 by Priyanka on her Instagram handle "@ml.india (Data Science & ML Mentors)". Priyanka has total 2.7K followers on Instagram and has a total of 65 post.This post has received 11 Likes which are lower than the average likes that Priyanka gets. Priyanka receives an average engagement rate of 0.92% per post on Instagram. This post has received 0 comments which are lower than the average comments that Priyanka gets. Overall the engagement rate for this post was lower than the average for the profile. #graphs #dataanalytics #tableau #visualization #datascience #python #analytics #ai #powerbi #nlp has been used frequently in this Post.
